

Each year, Resource Conservation Accounting division of Sustainability at Bellevue College provides GHG reports to the campus community along with all other relevant organizations. Greenhouse Gas Reporting Programs, in general, helps us better understand where greenhouse gas emissions are coming from and gives us the idea of how to make informed policy decisions by collecting accurate and timely GHG data.
As a part of the ACUPCC, Bellevue College uses the Clean Air Cool Planet Campus Carbon Calculator to conduct an internal Carbon Emissions Audit. The Carbon Audit Report is an internal audit on the inventory of greenhouse gas emissions attributed to Bellevue College campuses.
For the fiscal year 2011-2012, Bellevue College’s net emission of carbon dioxide (mTCO2) equivalent was 29,051.4 metric tons, which includes both direct and indirect emissions by the college from energy use, transportation, waste production, and refrigerant use. On the other hand, we received “carbon credit” for forest preservation (a relatively minor component for BC at this time). There was a steady rise in the total emissions (MT eCO2) from FY05/06 –FY10/11, but data from FY11/12 show the ship is beginning to turn. Emissions declined from the previous fiscal year by 1,278 MT eCO2 or around 4%, a small, but important step towards climate neutrality.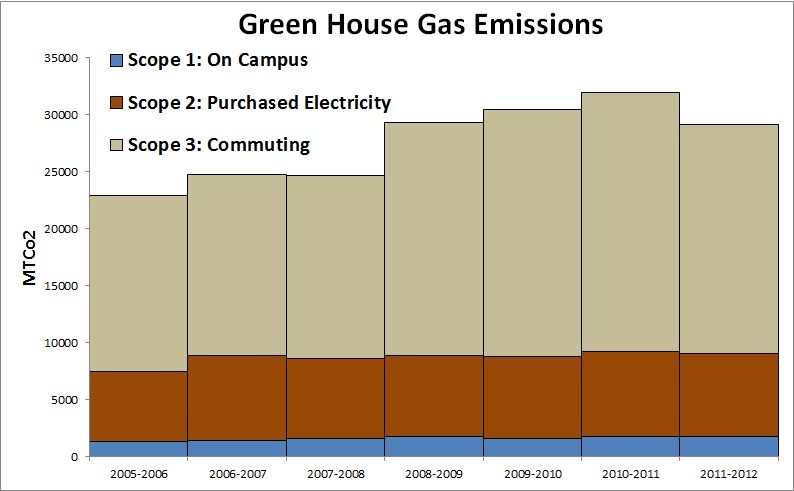
The major contributor to this decline in emissions can be directly attributed to transportation management programs launched in Fall 2011, which reduced single occupancy vehicle trips, and a dip in student population. Overall Scope 3 emissions, tied to transportation, declined 7%. Scope 1, on campus GHG emissions also declined 2% from the previous year, while purchased electricity from owning North Campus drove a 4% increase in emissions derived from campus consumption.
BC’s emissions are comparable to other community colleges when number of students (2.0 mTCO2 per student) and campus size (42.1 kgCO2 per square foot) are considered. Compared to 4-year universities, BC’s emissions per student are significantly lower, and our
emissions per square footage are higher. This is almost certainly a result of the large number of students we serve, and the fact that we are a commuter college.
| Campus Source | Scope | Emissions (MT eCO2) FY11/12 | Percent Total FY11/12 | Emissions(MT eCO2) FY10/11 | PercentTotal FY10/11 |
| Student Commuting | 3 | 16,149 | 56% | 17922 | 58% |
| Electricity Generation | 2 | 7,240 | 24% | 6,983 | 22% |
| Faculty/Staff Commuting | 3 | 2,536 | 9% | 3,113 | 10% |
| Natural Gas | 1 | 1,633 | 6% | 1770 | 6% |
| T&D Losses | 3 | 716 | 2% | 691 | 2% |
| Air Travel | 3 | 541 | 2% | 441 | 1% |
| Solid Waste | 3 | 87* | 0% | 112* | 0% |
| Refrigerants | 1 | 115* | 0% | 11* | 0% |
| Campus Fleet | 1 | 38* | 0% | 37* | 0% |
Considering the above data, in order to reduce carbon emissions, the efforts must be focused on the area of transportation and energy consumption. In addition, BC currently has very few carbon offsets, providing another area for major gains in reducing our net carbon output. Although there are many challenges associated with these reductions, as well as short-term costs, the benefits in the form of cost savings should be significant (reduced energy bills, reduced parking/road maintenance, prevention of the cost of a new parking structure, etc.) New buildings, such as the groundsource heated T building, break ground in July, and new students provide excellent opportunities to phase in changes that help to reduce our emissions. As we grow, (in enrollment and campus buildings), informed decision making will help offset costs and emissions.
Having the honor of being a model for our community and a successful institute of higher learning, it is Bellevue College’s role to help set the standard for a sustainable future. This carbon audit provides us with a baseline to start creating a campus that is a model of sustainability.
- Carbon Emissions Audit Report Update 2009-2010 (PDF)
- Carbon Emissions Audit Report 2005-06 to 2008-09 (PDF)
Written by Elham Zaeri – Resource Accounting Coordinator
Last Updated January 14, 2014