
Each year, Bellevue College’s Office of Sustainability provides Greenhouse Gas (GHG) reports to the campus community. GHG reporting programs help us better understand where campus greenhouse gas emissions are coming from and give us an idea of how to make informed policy decisions by collecting accurate and timely GHG data.
As a part of the American College & University Presidents’ Climate Commitment (ACUPCC), Bellevue College uses the Clean Air Cool Planet Campus Carbon Calculator to conduct an internal Carbon Emissions Audit, an inventory of greenhouse gas emissions attributed to the College’s educational programs and campus operations.
For the fiscal year 2012-2013, Bellevue College’s net emissions (MT eCO2) were 27,405.2, which includes both direct and indirect emissions by the college from energy use, transportation, waste, and refrigerant use. We received “carbon credits” of 48.7 (MT eCO2) for campus composting and forest preservation (a relatively minor component for BC at this time). There had been a steady rise in the total emissions from FY 05/06 through FY 10/11, but emissions first began dropping in FY 11/12 and they continued to fall in FY 12/13. FY 12/13 emissions declined from the previous fiscal year by 620 MT eCO2, or 2.2%, a small, but important step towards achieving climate neutrality.
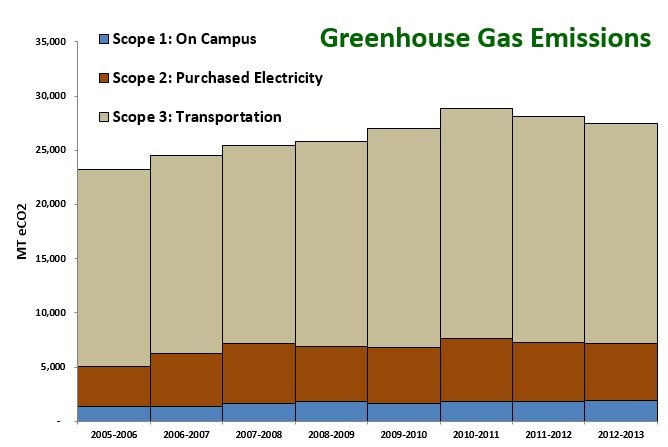
Contributors to this year’s emissions decline can be attributed to transportation management programs which have reduced single occupancy vehicle trips, a dip in student population, and campus energy conservation retrofits. Scope 2 (purchased electricity) emissions dropped by 5.4% in FY 12/13. Scope 3 (transportation) emissions declined by 2.1%; they would have declined further if total air miles travelled had not increased in FY 12/13. Scope 1 (On campus sources) jumped by 6.6% over the previous year.
Bellevue College Greenhouse Gas Emissions Chart for 2013
| Campus Source | FY 12/13 | Percent | FY 11/12 | Percent | Difference |
|---|---|---|---|---|---|
| Emissions (MT eCO2) | Emissions (MT eCO2) | Emissions (MT eCO2) |
|||
| Student Commuting | 16,479.7 | 60% | 16,771.1 | 60% | (291.4) |
| Electricity Generation | 5,218.7 | 19% | 5,516.0 | 20% | (297.3) |
| Faculty/Staff Commuting | 2,581.3 | 9% | 2,780.8 | 10% | (199.5) |
| Natural Gas | 1,792.8 | 7% | 1,632.9 | 6% | 159.9 |
| T&D Losses | 516.1 | 2% | 545.5 | 2% | (29.4) |
| Air Travel | 639.6 | 2% | 522.0 | 2% | 117.6 |
| Solid Waste | 72.2 | 0% | 87.1 | 0% | (14.9) |
| Campus Fleet | 37.3 | 0% | 37.9 | 0% | (0.6) |
| Auto Travel | 35.5 | 0% | 58.6 | 0% | (23.1) |
| Other | 80.7 | 0% | 122.3 | 0% | (41.6) |
| Total Emissions | 27,453.9 | 100% | 28,074.2 | (620.3) |
BC’s emissions are comparable to other community colleges when number of students (2.0 MT CO2 per student) and campus size (42.1 kg CO2 per square foot) are considered. Compared to 4-year universities, BC’s emissions per student are significantly lower, and our emissions per square footage are higher. This is almost certainly a result of the large number of students we serve, and the fact that we are a commuter college.
Given the above data, efforts must continue to be focused on the area of transportation and energy conservation in order to reduce campus carbon emissions. In addition, BC currently has very few carbon offsets, providing another opportunity for major gains in reducing our net carbon output. Although there are many challenges associated with these reductions, as well as short-term costs, the benefits in the form of cost savings should be significant (reduced energy bills, reduced parking and road maintenance, avoidance of a new parking structure, etc.). New buildings, such as the ground-source heated T Building which broke ground in August, provide excellent opportunities to phase-in changes that reduce our emissions. As Bellevue College grows (in both enrollment and campus buildings), informed decision making will help to offset costs and greenhouse gas emissions.
Bellevue College has the honor of being a role model for our community as a successful institution of higher learning, and is helping to set the standard for a sustainable future. This carbon audit provides a baseline to start creating a campus that is a model of sustainability.
2006-2008 Carbon Emissions Audit Report
2009-2010 Carbon Emissions Audit Report Update
Last Updated October 28, 2021