
Each campus building is connected to a dashboard where you can see, analyze, and manipulate energy and water data. We have two separate dashboard systems, one for the main and north campus, and one for student housing. Please check out the instructions below on how to use each system.
We also have an air quality sensor on campus.
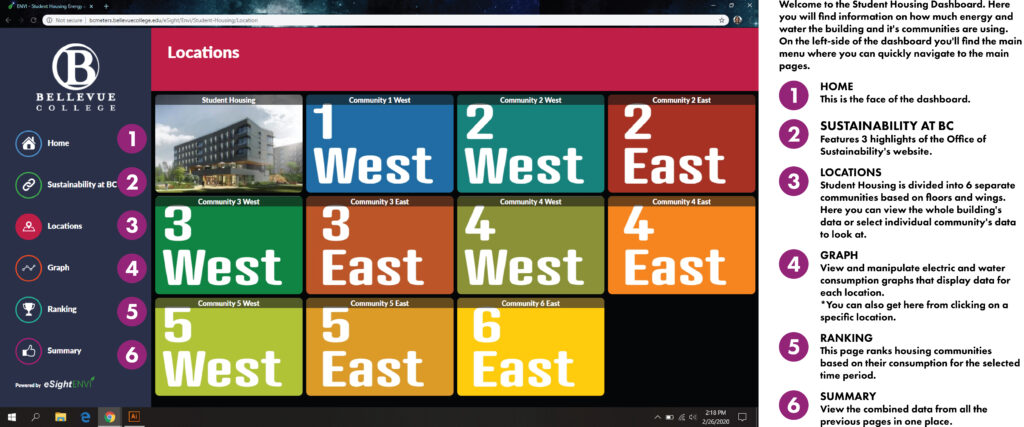
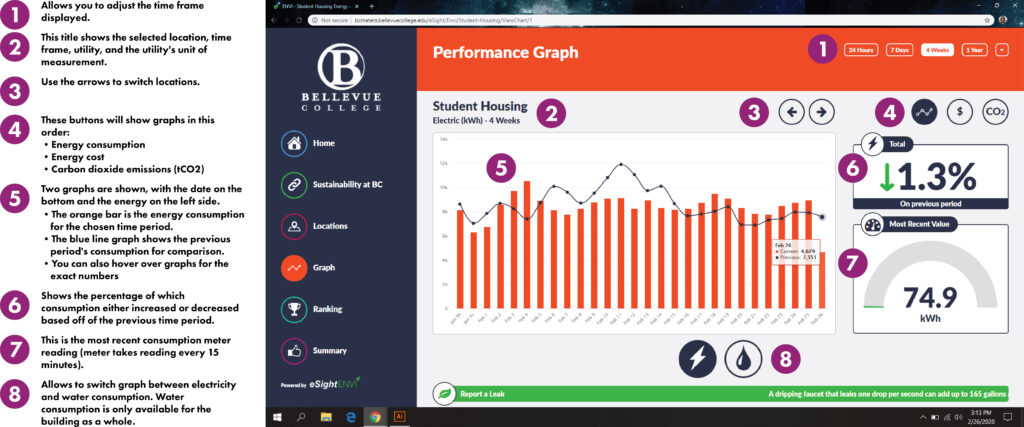
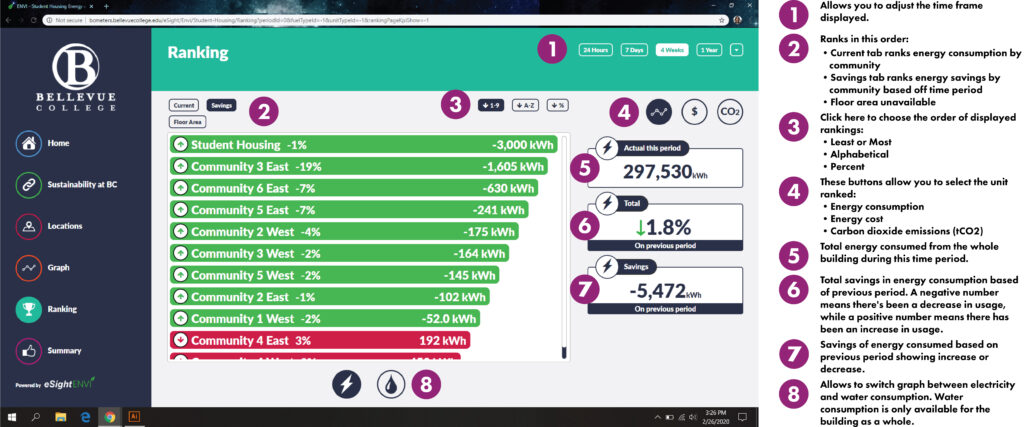
1. Student Housing Dashboard
Click on the link below to view the Student Housing Dashboard which observes, analyzes, and records resource data on Student Housing.
https://bcmeters.bellevuecollege.edu/eSight/Envi/Student-Housing
2. Main & North Campus Dashboard
Real-time data on North Campus and Main Campus buildings, excluding Student Housing.
Available for students, staff, or faculty to view and manipulate energy and water data. Does not require connection to the Bellevue College network.
To access:
Guest Login User ID: BCGuest
Guest Login Password: BCGuest
Visit the Building Dashboard home page.
Watch the instructional videos: intro, energy app (usage, profile, operation), historian app, key performance indicators app.
3. Air Quality
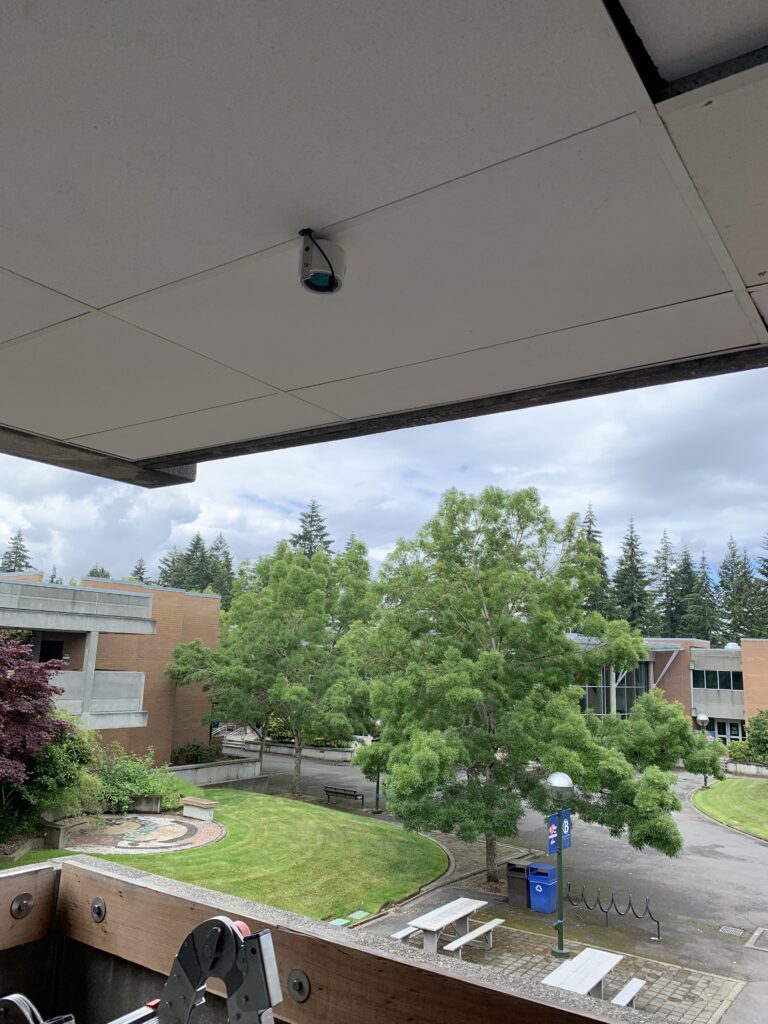
This sensor is located outside of the B building, and shows the real time air quality for the middle of our campus. This sensor is called BCAirmonitor-01.
This sensor measures PM1.0, PM2.5, PM10, air temperature, and humidity. Learn more about particulate matter and why it’s important to monitor for air quality.
Check out the historical data for the Bellevue College B Building sensor. You will need to download the excel file.
To see other air quality sensors regionally and worldwide, check out the PurpleAir Map.
Last Updated April 20, 2026